
Comparability and benchmarking for IFRS mapping
Comparability
The ability to compare companies is fundamental to investment decisions. When evaluating a company, one of the first things an investor or creditor does is looking at how this company performs relative to its peers. Are its margins higher or lower? Is its leverage comparable? Is its tax position unusual?
IFRS, as a common set of accounting standards used by listed companies in Europe and in many other jurisdictions worldwide, exists precisely to make this comparison possible. It promotes a consistent vocabulary, and consistent recognition and presentation principles for every company applying the standards, while leaving sufficient flexibility to adapt to the many circumstances of companies internationally.
Yet, in using this flexibility, companies ought to be careful: the comparative analysis investors and creditors seek to perform is only possible if the data is presented in a way that makes comparison meaningful.
The consequence for a company of deviating from comparable presentations are tangible.
Research has shown that companies whose financial statements are less comparable to their peers tend to attract fewer analysts and bear a higher cost of capital: investors demand a premium for the additional effort and uncertainty involved in analysing them.
In particular, see the following:
- De Franco, Gus and Kothari, S.P. and Verdi, Rodrigo S., The Benefits of Financial Statement Comparability (March 14, 2011). Available at SSRN: https://ssrn.com/abstract=1266659
- Imhof, Michael and Seavey, Scott and Smith, David B., Comparability and Cost of Equity Capital (December 2, 2016). Accounting Horizons, Vol. 31 No. 2, 2017, Available at SSRN: https://ssrn.com/abstract=2844991
- Many other academic articles are referenced in the IASB literature review for the preparation of IFRS 18: https://www.ifrs.org/content/dam/ifrs/meetings/2021/january/iasb/ap21e-primary-financial-statements.pdf
On the digital side, this means that a company whose data does not fit expected patterns risks being overlooked entirely; not because of poor performance, but because its data is harder to use.
The IFRS Accounting Taxonomy and machine-readable comparability
Under many reporting frameworks, issuers are required to publish their annual financial reports in digital formats, such as ‘ESEF’ in Europe.
This digital reporting pushes comparability to a further level. Its core aspect is that numerical amounts and disclosures must be marked up with metadata that identifies precisely what each means, in direct reference to the IFRS Accounting Standards paragraphs whenever possible.
The IFRS Accounting Taxonomy is the structured representation of the IFRS that enables this. It contains precisely defined elements corresponding to items, subtotals and totals described in the standards, as well as many items of common practice.
Marking up a set of financial statements in such a digital format is yet another exercise in comparability: even when two companies use a similar presentation of their financial statements, if they make different choices in the digital mark-up, then these financial statements may appear digitally non-comparable.
Of course, the design of the IFRS Accounting Taxonomy, as well as the rules of digital reporting applied in each jurisdiction are usually intended to reduce the likelihood of two similar presentations being marked-up differently. In practice, deviations aren’t so rare.
Fortunately, digital reporting itself provides a solution to this issue. As it greatly simplifies the access and parsing of financial statements, it also conveniently makes research into common presentation practices quite easy.
Nokia’s 2025 report: a concrete example
Nokia Corporation, listed on Nasdaq Helsinki, recently published its consolidated financial statements for 2025. In the balance sheet, Nokia presents, as many of its peers do, and following the IFRS, a line labelled ‘Deferred tax assets’, presented within non-current assets, representing its deferred tax assets.
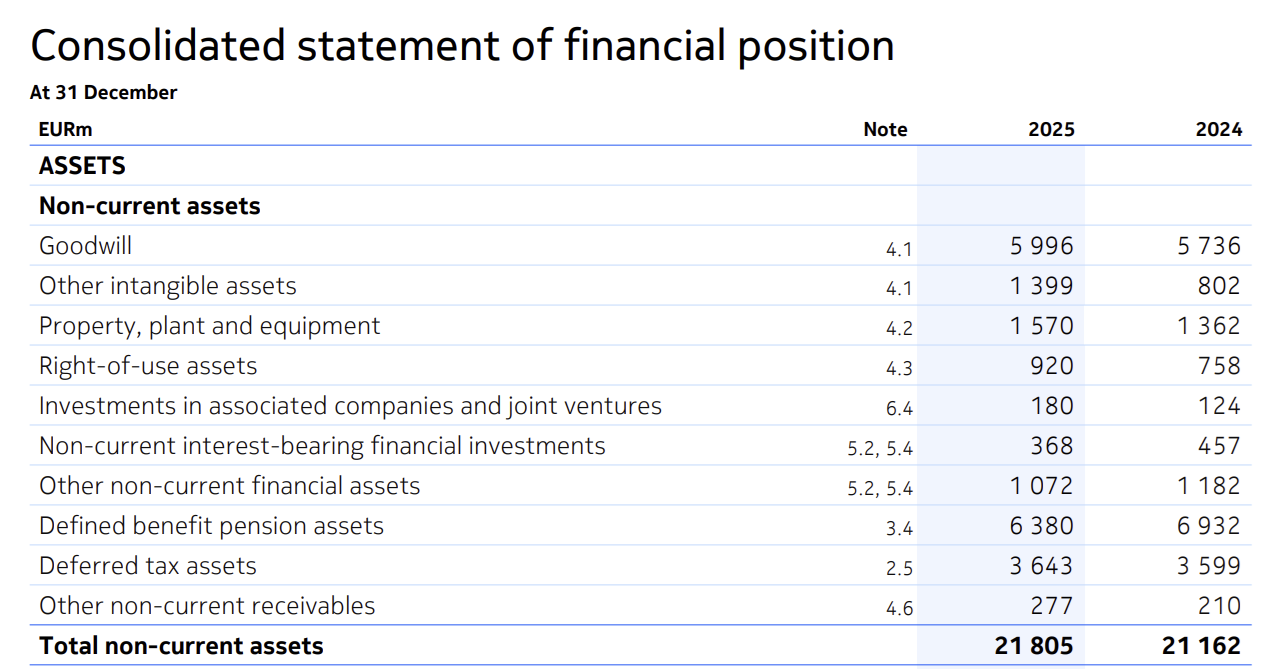
There is nothing unusual about the presentation of this line, nor about its meaning. It really is deferred tax assets.
In particular, it importantly is not net deferred tax assets. Offsetting deferred tax assets and deferred tax liabilities is generally not allowed, and so net deferred tax assets isn’t an item one would ever expect to be presented in a balance sheet.
The IFRS Accounting Taxonomy does include an element to represent Net deferred tax assets; but it is as an element of common practice meant for the notes, for instance when an issuer shows the sum of the deferred tax assets and deferred tax liabilities for a specific type of temporary difference.
As you may have guessed, Nokia marked-up their ‘Deferred tax assets’ with the Net deferred tax assets element, breaking digital comparability with its peers. This is an issue that could be easily solved with benchmarking.
Detecting the issue through peer benchmarking
Rift Technologies’ validation tool includes an embedded database of the presentation practices published by more than 3000 companies in Europe, as well as their mark-up choices.
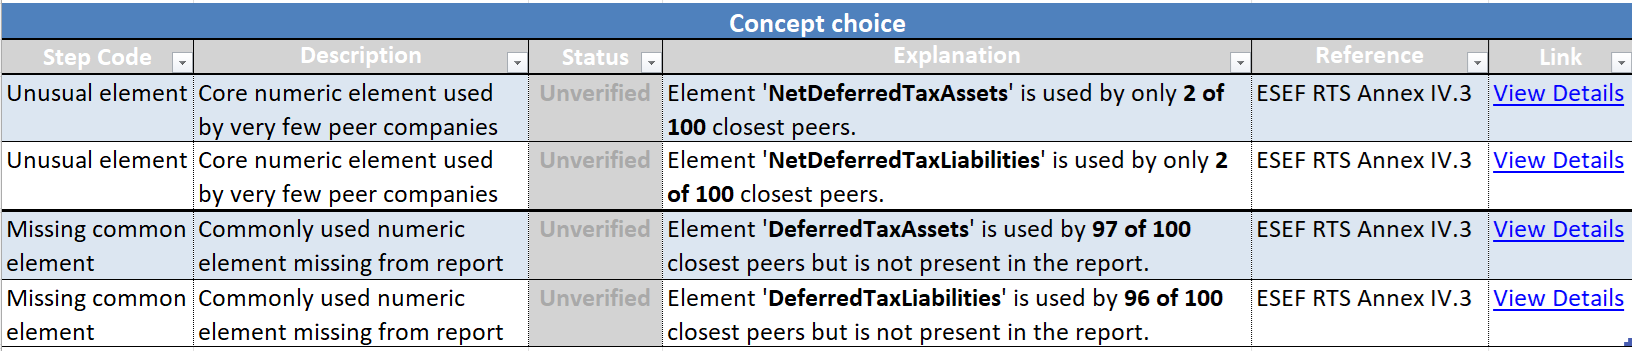
When a report is reviewed, it automatically identifies the 100 closest peers through presentation practices, and compares the mark-up against this group. As such, the reviewer can easily identify:
Any unusual item in the report that very few peers used in their report
Any missing very common item, that almost all peers use but the reviewed report does not
As such, when a company selects by mistake the wrong element for mark-up, the benchmark review will very clearly create a pair of such messages, indicating which element is wrong, and with which element it should be replaced!
As such, with a benchmark approach, even a reviewer without expertise on IAS 1 and IAS 12 offsetting rules can easily detect the anomaly, investigate and apply the correct fix.
And indeed, it is often too complex to try and apply expertise across all IFRS standards on every single item of a set of financial statements during a review. Practice has proven that such tool assistance is very often necessary, and experts can jump in to investigate issues the tool flags.
Our peer comparison in the Rift validation engine is designed to make this investigation as straightforward as possible. Rather than just comparing against all reporting entities, each flagged element is presented with its peer usage statistics, and the peer group itself is carefully curated. We also ensure the embedded data is always up-to-date, to provide the reviewer with all the necessary context to make an informed decision.
Do you want to know more about these capabilities in the Rift validation engine, or about its other features? Don’t hesitate to contact us, we will be happy to discuss!